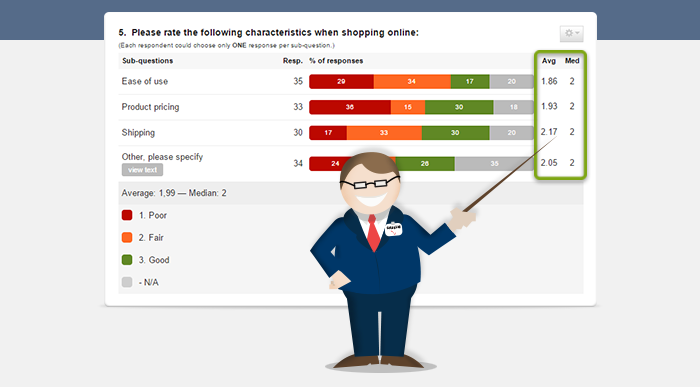
Have you noticed? We added 2 new columns to the charts for matrix questions: average and median.
You were always able to see the general average and median for the entire matrix question in the legend below each matrix chart. This was already very useful data. But sometimes you just need to dig in deeper.
Using the raw data in Excel you could, of course, always calculate the average and median per sub-question yourself. We believe you have better things to do with your time, though, so we decided to do the work for you. You can now tell at a glance what the average and median per sub-question is.
No more counting and analyzing and verifying and double-checking. You have the exact figures right there, in the same chart along with all your other data.
More actionable insights in less time. What else could you possibly want?

Geef een antwoord